


Blog
Building high-performance category management
By Mark Webb |
Part 1 – the size of the prize and key indicators
Building high-performance category management and improving the value impact of category management through reducing costs is driven by two factors – firstly, by increasing the savings rates achieved from category management projects, and secondly, by increasing the proportion of spend that is covered by category strategies.
The FP/Henley Business School 2019-20 Global Category Management Leadership Report report shows that the higher performers (leaders) achieve an average cost savings rate of 9.0% from their category management projects, compared to 6.4% for lower performers (followers) Leaders also believe there is an additional 5.3% of cost savings available if they were able to secure all opportunities from a category project. This demonstrates that potential savings of 14.3% are considered to be available from the average category project.
In terms of the proportion of their spend covered by category strategies, leaders have 69%, compared with 44% for followers. The survey results also demonstrate that the small number of teams that have fully optimised category management are achieving 78% category strategy spend coverage. This appears to be a reasonable potential target for all teams.
The graph below shows the combined performance of savings rates and strategy spend coverage for followers, leaders, and the potential performance available. The graph also includes the total savings achieved at each of the three levels per €1 billion spend.
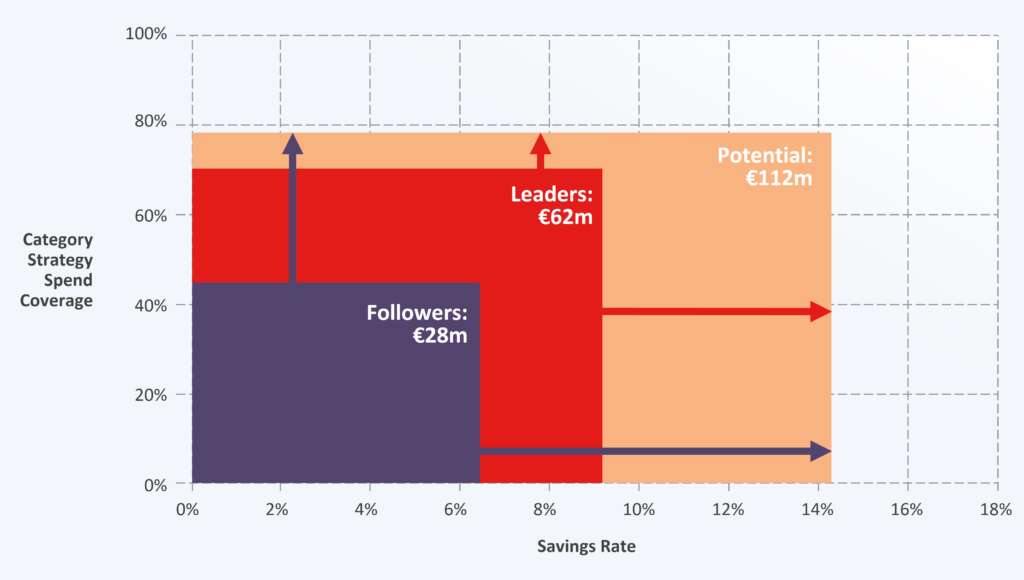
Given that 78% of organisations in our research identified as category management followers and 22% as leaders, there is a significant opportunity for improvement. Followers becoming leaders will more than double their savings and achieving the full potential will increase their savings performance by 4x (from €28m to €112m). Leaders can increase their savings performance by 1.8x increase (from €62m to €112m).
Business benefits from becoming a high performing category management operation
In addition to the cost reduction uplifts achieved, category management leaders also see performance benefits in other areas that directly relate to typical procurement team KPIs:
- Risk: Leaders generate 2x higher risk opportunities compared with category management followers.
- Revenue: Leaders generate 2x higher revenue opportunities compared with category management followers.
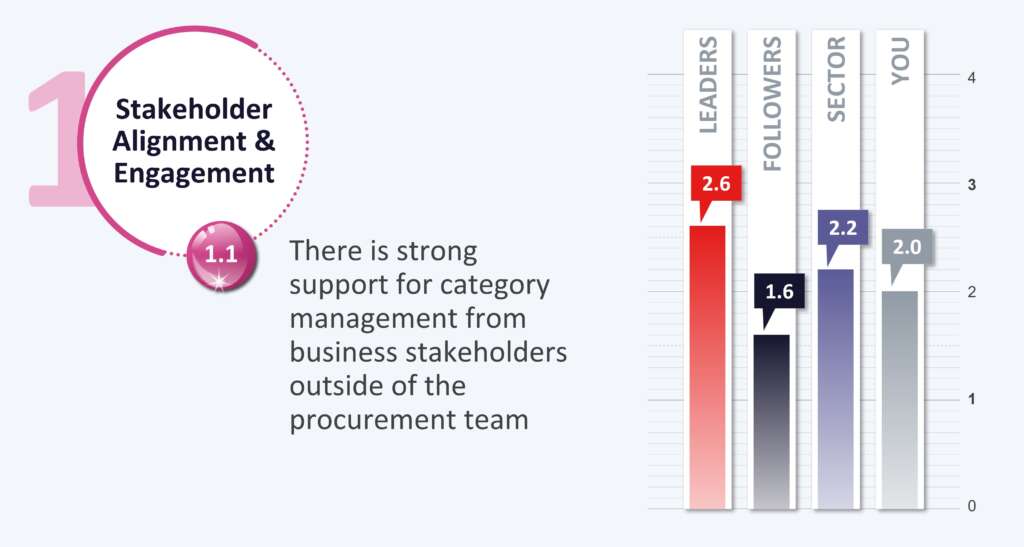
- Stakeholder support: Leaders enjoy 3x the level of stakeholder support achieved by followers.
- Category strategy quality: Leaders create category strategies that are 5x better than those of followers.
Key indicators of high performance category management operation
Through the research and practical experience with clients we have identified a set of metrics that can be used to provide a snapshot assessment of your current category management performance:
- Plan for category management adoption: Clear plan for implementation and development supported with objectives, investments, and targets e.g. category strategy coverage and overall savings and value delivery.
- Spend covered by category strategies: % of supplier spend covered by documented category strategies.
- Savings per category strategy: average % savings value identified and delivered from category strategies.
- Risk and stakeholder value per category strategy: average number of risk and stakeholder value (e.g. time to market, revenue generation, innovation, sustainability etc) opportunities identified in category strategies.
- Quality of category strategies: average scores for category strategies as measured through a formal category strategy assessment process.
- Stakeholder support for category management: measured by internal surveys of executive stakeholders, budget holders and cross-functional team members.
- Joint category management project objectives: % of category management projects where both Procurement team and stakeholders have individual objectives for delivery.
- Procurement team category management understanding: average score for agreed range of Kirkpatrick learning metrics – particularly levels 2 and 3.
Benchmark where you are on the journey to high performance category management and identify targeted changes to ‘make it stick’
Contact us [email protected] to run a Category Management Maturity Assessment to pinpoint where you are on the journey to embed CatMan and benchmark your performance versus leaders and your sector. Based on our 1,500+ global respondent research, we can build a rapid picture and identify strengths, gaps, development priorities.
The assessment also allows us to identify the additional value available to your organisation from optimising category management.
If you would like to request a copy of The FP/Henley Business School 2019-20 Global Category Management Leadership Report, please do so below, we will immediately send you the Executive Summary followed by the report when we have verified your details.

About Mark Webb
Managing Director
30+ years procurement experience in line management
and consulting roles.
Previous employment: Price Waterhouse, Mobil Oil and QP Group
Education: BSc in Management Science and MSc in Business by Research, Aston University
CIPS: Member